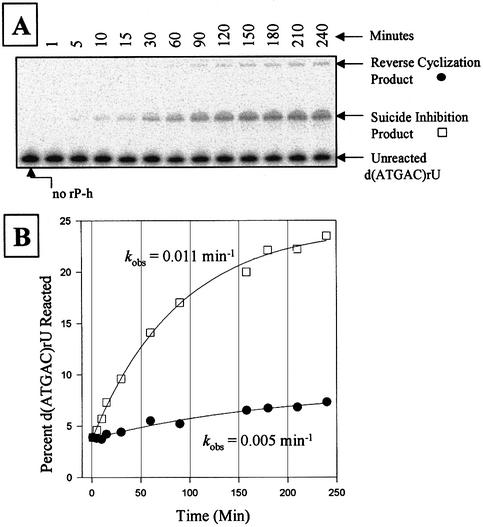
Figure 4.
Kinetic analysis of suicide inhibition and reverse cyclization reactions using 500 nM rP-h and 1 nM radiolabeled d(ATGAC)rU in 50 mM HEPES (25 mM Na+), 4 mM MgCl2 and 135 mM KCl at pH 7.5. (A) A polyacrylamide gel showing a time dependence assay of a typical suicide inhibition and reverse cyclization reaction, using d(ATGAC)rU as the substrate. Note that both reactions occur simultaneously. (B) Graph showing the plot and curve-fit for the suicide inhibition (open square) and reverse cyclization reactions (solid circle) in (A). Note that the results in the Table 5 are an average of two independent assays.

