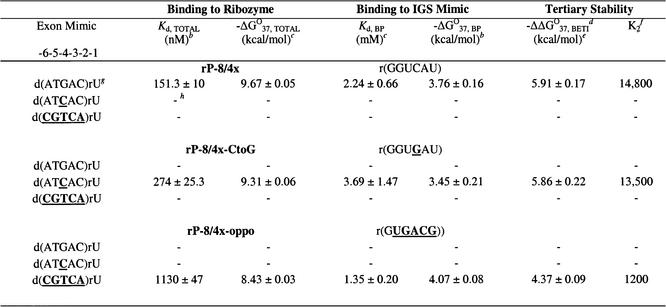
Table 6. Thermodynamic parameters for representative exon mimics binding to ribozymes and to IGS mimics in H15Mg buffera.
aH15Mg buffer consists of 50 mM HEPES (25 mM Na+), 15 mM MgCl2 and 135 mM KCl at pH 7.5. Nucleobases that are bold and underlined represent deviations from the native 5′ exon sequence d(ATGAC)rU.
bKd, TOTAL was measured by a direct band-shift electrophoresis assay with r(AUGACU) and –ΔG°37, BP was measured by thermal denaturation analysis. The error is the standard deviation of the measurements.
cCalculated from –ΔG°37 = RTln(Kd) where R = 0.001987 kcal mol–1 K–1 and T = 310 K, using more significant digits than listed in this table.
dBETI represents Binding Enhancement by Tertiary Interactions.
eFree energy increment from tertiary interactions calculated from the difference in –ΔG°37 values [(–ΔG°37, TOTAL) – (–ΔG°37, BP)]. The –ΔΔG°37, BETI error was calculated from the square root of the sum of the squares of each individual –ΔG°37 error.
fThe K2 values were calculated by dividing Kd, BP by Kd, TOTAL, using Kd values containing more significant digits than those listed in this table.
gDissociation constants (Kds) obtained through direct band-shift assays are typically 2.5 times larger than those obtained through the competitive band-shift assay (6,53).
hA dash (–) indicates no measurable binding (Kd > 1.5 µM).

