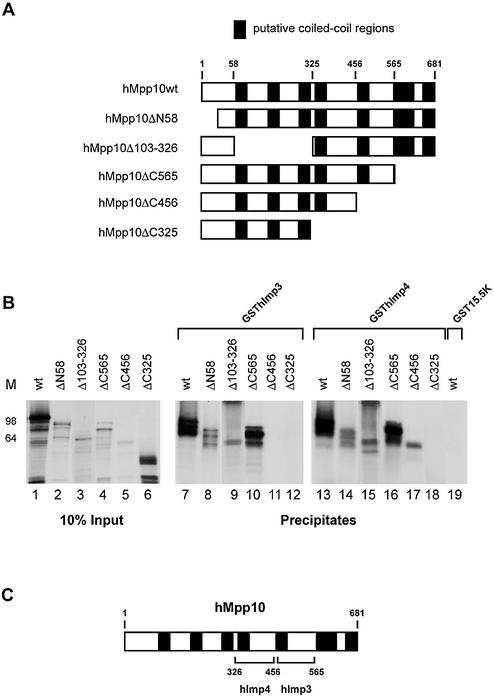
Figure 6.
Regions of hMpp10 involved in its interaction with hImp3 and hImp4. (A) Schematic representation of the hMpp10 deletion mutants. The black boxes represent putative coiled-coil regions in hMpp10 (32). (B) Binding of GSThImp3 and GSThImp4 to hMpp10 deletion mutants. GST pull-down experiments were performed with GSThImp3, GSThImp4 and GST15.5K. Lanes 1–6 show 10% of the input material. Precipitation of hMpp10 mutants by GSThImp3 is shown in lanes 7–12, by GSThImp4 in lanes 13–18 and precipitation of wild type hMpp10 by GST15.5K in lane 19. On the left of the panel the positions of molecular mass markers are shown. (C) Schematic representation of the results shown in (B).

