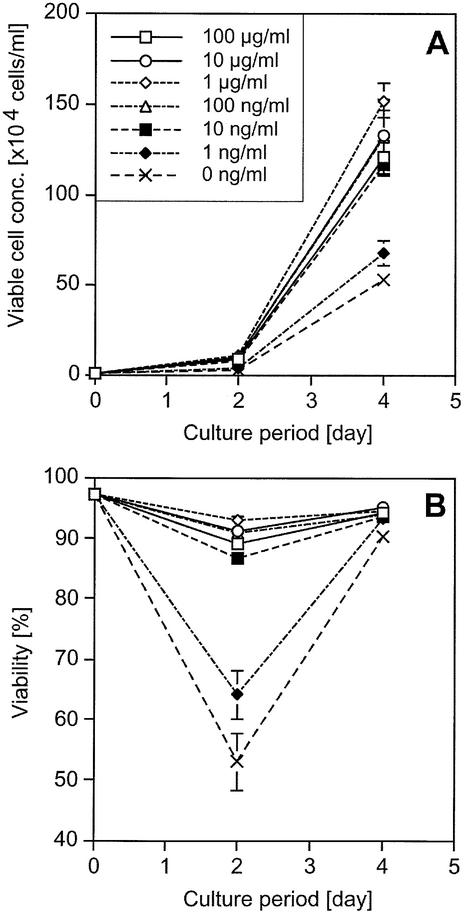
Figure 6.
Growth and viability curves of Ba/HgIGFP+Lg cells. Cells (104 cells/ml) were inoculated into 24-well plates at day 0. Viable cell concentration and viability of triplicates are plotted with average and 1 SD. (A) HEL-dependent growth of Ba/HgIGFP+Lg cells. (B) Viability of the same cells, where the keys are as in (A).

