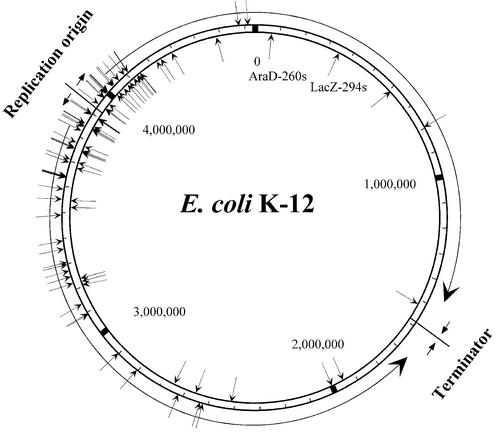
Figure 7.
Distribution of targetron insertion sites in the E.coli genome. The map was compiled using the genome sequence of E.coli K-12 MG1655 (GenBank accession no. U00096) (31). The figure shows the bidirectional replication origin (oriC) and the terminator region, with the direction of replication indicated by arrows. Integration sites in the outside and inside strands are indicated by arrows pointing to the sites. The locations of the integrated LacZ-294s and AraD-260s introns amplified from the knockout library by PCR are also shown (see text).

