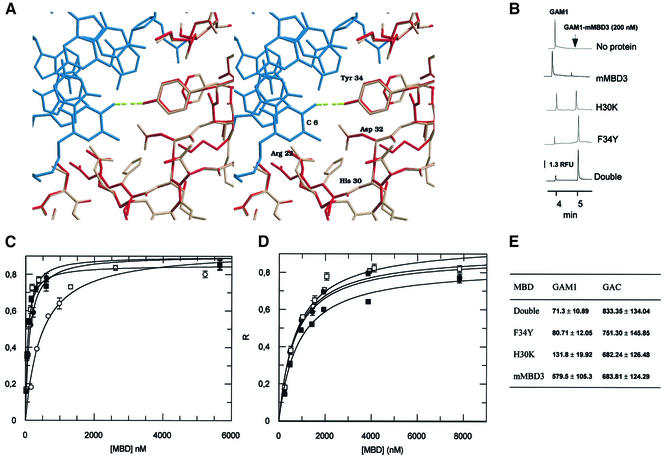
Figure 3.
Influence of F34Y and H30K mutations on the DNA binding affinity of murine MBD3. (A) Stereoview of the interaction between Tyr34 of human MBD1 (red) and the C6 amino group of the methylated DNA (blue); PDB entry 1IG4. The model of murine MBD3 (pink) has been superimposed on the MBD1 structure (red). The change of tyrosine/phenylalanine promotes the disruption of the hydrogen bond between the amino acid at position 34 and the methylated C6 in the major groove. The figure was produced using Raster3D (29). (B) Electropherograms for mixtures of GAC DNA oligo (24 nM) and 200 nM of wild-type mMBD3, H30K, F34Y and double mutant MBD3 in 10 mM Tris–HCl pH 8.0, 3 mM MgCl2, 50 mM NaCl, 0.1 mM EDTA, 0.1% NP-40, 2 mM DTT, 5% glycerol and 0.4 mg/ml BSA. Analytical conditions as in Figure 2A. RFU, relative fluorescence units. (C) Single-site ligand binding fit for mMBD3 (white circles), F34Y (black circles), H30K (white squares) and double mutant (black squares) with the synthetic oligo GAM1 using GraFit 3.1 software. R, saturation ([complex]/[complex] + [DNA]). Results are expressed as mean ± SD. Analytical conditions are as described in Figure 2A. (D) Single-site ligand binding fit for wild-type MBD3 (white circles), F34Y (black circles), H30K (white squares) and double mutant (black squares) with the synthetic oligo GAC using GraFit 3.1 software. R, saturation ([complex]/[complex] + [DNA]). Results are expressed as mean ± SD. Analytical conditions as described in Figure 2A. (E) R1/2 values for wild-type mMBD3, H30K, F34Y and double mutant MBD3 and synthetic oligos GAM1 and GAC forms calculated by fitting the data obtained from R-CEMSA to non-cooperative binding. Results are expressed as mean ± SD. Values are expressed in molar units and are multiplied by 109.

