Figure 1.
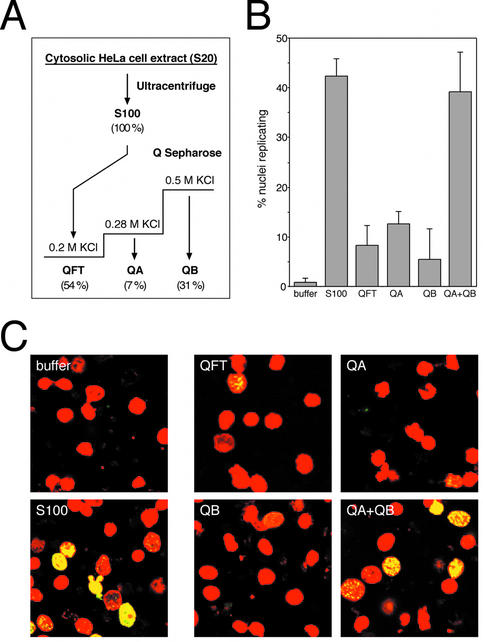
Initial fractionation of cytosolic extract. (A) Schematic diagram of fractionation steps. See Materials and Methods for details. The values given in parentheses below each fraction indicate the percentages of total protein recovered in the respective fraction. (B) Quantitative analysis of DNA replication initiated in isolated G1 phase nuclei in vitro. Nuclei from mimosine-arrested HeLa cells were incubated in elongation buffer (buffer), supplemented with 100 µg protein of unfractionated extract (S100), 45 µg of fraction QFT, 15 µg of QA, 35 µg of QB and a combination of 15 µg QA and 35 µg QB as indicated (these masses approximate typical mass percentages of the respective fractions in the S100 extract). Percentages of replicating nuclei were quantitated and mean values and standard deviations of 5–10 independent experiments are shown. The main variance of the percentages of nuclei replicating in the indicated fractions was due to differences between separate preparations of fractions. (C) Representative fields of replicating nuclei. Replication reactions were performed in the presence of the indicated components and nuclei were analysed by confocal fluorescence microscopy. Nuclear DNA is visualised by propidium iodide (red signal) and replicated DNA by fluorescein-conjugated anti-digoxigenin Fab fragments (green signal). Merged images are presented showing sites of replicated nuclear DNA in yellow and non-replicating nuclei in red.

