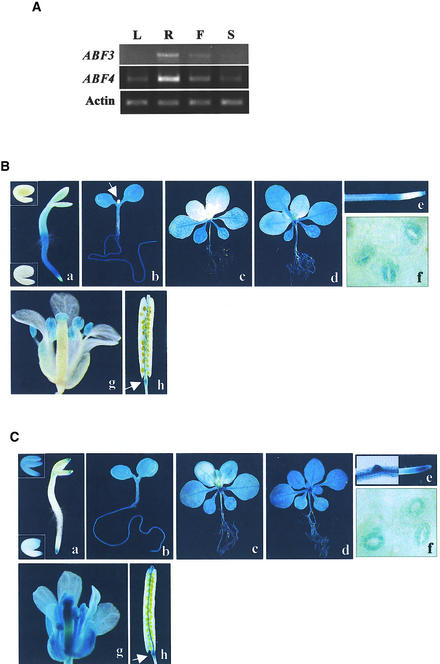
Figure 7.
Expression Patterns of ABF3 and ABF4.
(A) Tissue specificity of ABF3 and ABF4 expression. RNA was isolated from various tissues of wild-type plants grown under normal conditions, and the expression of ABF3 and ABF4 was determined by coupled RT and PCR. L, leaves from 3-week-old plants; R, roots from 3-week-old plants; F, flowers; S, immature siliques.
(B) and (C) Histochemical GUS staining of ABF3 and ABF4 promoter activity, respectively. T3 homozygous plants were stained with 5-bromo-4-chloro-3-indolyl-β-glucuronic acid for 6 hr ([e] and [f]) or 24 hr (other panels).
(a) Two-day-old seedlings. Insets show embryos from immature siliques (top) or dry seed (bottom).
(b) Five-day-old seedlings. The arrow in (B) shows the newly emerging shoot.
(c) Two-week-old seedlings.
(d) Two-week-old seedlings treated with 100 μM ABA (ABF3) or 200 mM NaCl (ABF4).
(e) Root tips. The left half of the image in (C) shows a lateral root primordium.
(f) Guard cells.
(g) Flowers.
(h) Siliques. Arrows indicate the silique abscission zone.

