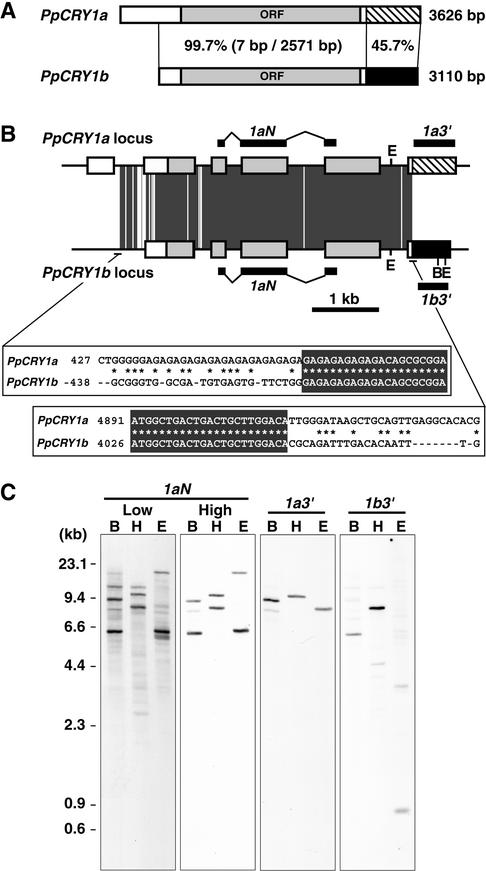
Figure 1.
Gene Structures of Moss Cryptochromes.
(A) Scheme of the PpCRY1a and PpCRY1b cDNAs. The striped and black regions show the nucleotide sequences that are different between the PpCRY1a and PpCRY1b cDNAs. The percentages of identical nucleotides in the regions are shown. In the PpCRY1b transcript, the 5′ untranslated region of the PpCRY1b cDNA might be truncated, based on its size (see Figure 3C). ORF, open reading frame.
(B) Scheme of the PpCRY1a and PpCRY1b genes. The boxes indicate exons, and each box pattern is the same as in (A). The positions of the probes used in (C) are indicated. The dark gray regions indicate sequences that are identical between PpCRY1a and PpCRY1b. The nucleotide sequence alignments at the beginning and the end of the identical regions are shown. The recognition sites of BglII (B) and EcoRI (E) are indicated.
(C) DNA gel blot analysis of the PpCRY1a and PpCRY1b genes. Genomic DNA was digested by BglII (B), HindIII (H), or EcoRI (E). Blots were hybridized with the probe (1aN) specific to both cryptochrome genes under either low- or high-stringency conditions. The data for each specific probe (1a3′ and 1b3′) were obtained under high-stringency conditions.

