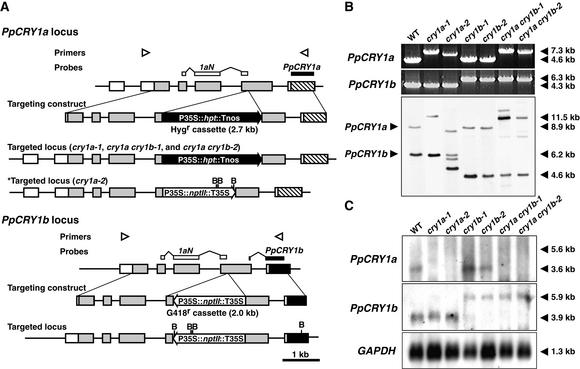
Figure 3.
Cryptochrome Targeting Constructs and Confirmation of Disruption.
(A) Scheme of the disruption of the PpCRY1a and PpCRY1b loci. The locations of primers used in (B) are shown by arrowheads. The probe that is supposed to hybridize both PpCRY1a and PpCRY1b (1aN) and that is used in (B) is indicated by white boxes, and the probes specific to each cryptochrome transcript used in (C) are indicated by closed boxes. The recognition sites of BglII (B) are indicated as well. Tnos, nopaline synthase terminator; Hygr, hygromycin-resistant; nptII, neomycin phosphotransferase II; hpt, hygromycin B phosphotransferase.
(B) PCR genotyping analysis and genomic DNA gel blot analysis of cryptochrome disruptants. Genomic DNA was digested with BglII. The bands corresponding to either native PpCRY1a or PpCRY1b loci are indicated at left. The lengths of major bands are shown at right. WT, wild type.
(C) RNA gel blot analysis of CRY transcripts in the cryptochrome disruptants. Poly(A)+ RNA derived from white light–grown protonemata were analyzed. As an internal control, the 1.1-kb fragment of Physcomitrella glyceraldehyde 3-phosphate dehydrogenase (GAPDH) cDNA was used (Leech et al., 1993).

