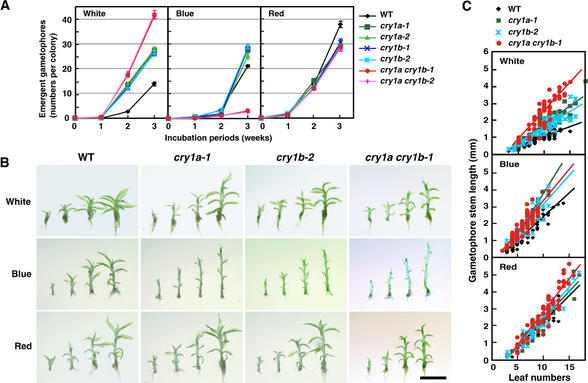
Figure 5.
Gametophore Induction and Development Are Regulated by Cryptochromes.
(A) Number of gametophores that emerged on the colonies of the cryptochrome disruptants. The colonies were incubated under white, blue, or red light for up to 3 weeks. Gametophores that emerged were counted every week. Each point represents the mean ±se derived from the data of 30 independent colonies.
(B) Representative images of gametophores of one of each cryptochrome disruptant. Gametophores were collected from 3-week-old colonies after inoculation. The gametophores, which have 5, 7, 9, and 11 recognizable leaves, are placed from left to right in each image. Each image shows the gametophores of wild type, cry1a-1, cry1b-2, or cry1a cry1b-1 incubated under white, blue, or red light. The strains that are not shown here had the same phenotypes as each representative image of the cryptochrome disruptants. Bar = 2 mm for all panels.
(C) Relationship between leaf number and stem length. Tissue was considered as a leaf if it clearly looked separate from the stem or if the conical premature leaf bundle appeared at the gametophore apex. The stem length is the length from the position of the shoot apical meristem (presented in the apical leaf bundle) to the end of the stem, not including rhizoids. Slopes calculated by fitting a linear regression line for each group of data are shown in the graph.

