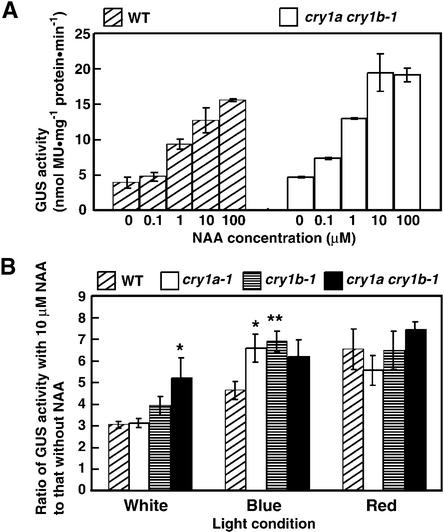
Figure 7.
Measurements of Auxin Signals in Cryptochrome Disruptants.
(A) Soybean GH3 promoter activity in moss. The GH3::GUS vector was transformed into moss protoplasts and incubated under white light for 24 hr in the presence of different doses of NAA. The data show the mean ±se derived from one trial, which consisted of two sets of group data at each point. Similar data were obtained in different trials. MU, 4-methylumbelliferone.
(B) Induction rates when exogenous NAA was added to the cryptochrome disruptants. The data show the induction values (mean ±se), which were calculated by dividing the means obtained from the data without NAA into the means obtained from the data in the presence of 10 μM NAA. These data were obtained from three different trials, each trial of which constituted of three different sets of group data (total, nine groups of data). * P < 0.05, ** P < 0.01 (Student's t test).
WT, wild type.

