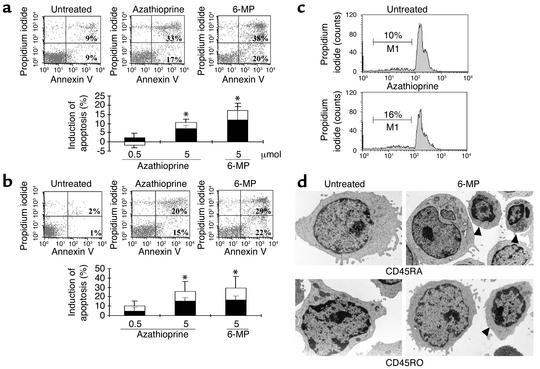
Figure 1.
Azathioprine and its metabolites induce T cell apoptosis. CD45RA (a) and CD45RO (b) T cell subsets were isolated from peripheral blood of healthy volunteers and stimulated with antibodies to CD3 and CD28 and recombinant IL-2 in the presence or absence of indicated concentrations of azathioprine and 6-MP. T cell apoptosis was assessed by FACS analysis after 5 days of cell culture. Azathioprine and 6-MP led to an induction of annexin-positive, propidium iodide–negative T cells, suggesting that they induced T cell apoptosis. The FACS data is representative of 6–10 independent experiments per group. The average induction of specific apoptosis from 6–10 patients per group (induction of annexin-positive, propidium iodide–negative cells compared with untreated cells indicated by black sections of bars, induction of annexin-positive, propidium iodide–positive cells compared with untreated cells indicated by white sections) by azathioprine and 6-MP ± SEM is shown in the lower panels. Statistically significant changes are indicated (*P < 0.01). (c) Determination of apoptosis and cell cycle distribution by the Nicoletti technique. Peripheral blood CD4+ T cells from healthy volunteers were stimulated as above for 5 days, followed by analysis of DNA content by the Nicoletti technique. The percentage of apoptotic cells in the subdiploid peak is indicated by M1. (d) Azathioprine and 6-MP induce morphologic changes of CD45RA CD4+ T cells (upper panels) and CD45RO CD4+ T cells (lower panels) indicative of apoptosis, as assessed by transmission electron microscopy. Peripheral blood CD4+ T cells from healthy volunteers were stimulated as above for 5 days. Upon 6-MP treatment, T cells exhibited typical signs of apoptosis (arrowheads), with dense nuclear condensation and degeneration of organelles. Magnification, ×7200.

