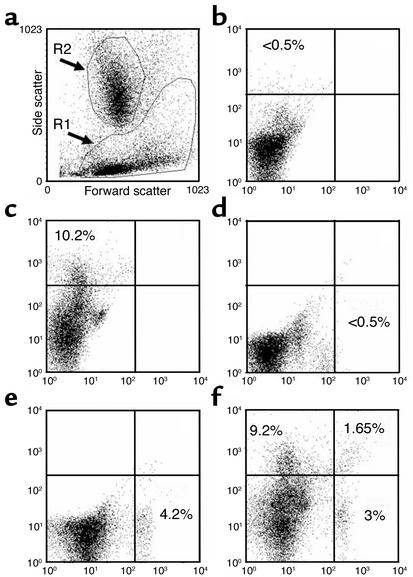
Figure 1.
Representative flow cytometry dot plots sorted for BAP+/RANKL+ cells from bone marrow aspirates of an untreated postmenopausal woman. (a) Forward/side light scatter profile of unstained cells following Ficoll-Paque density centrifugation. The R1 gate represents the mononuclear cells that include the MSCs. The R2 gate represents granulocyte precursor cells and these are excluded from analysis. (b) The dot plot profile of the autofluorescence from the irrelevant mouse IgG1 isotype that was used as a control for anti-BAP Ab. (c) The dot plot profile of the BAP+ cells (left upper quadrants in a–f) as assessed by single-color flow cytometry using the monoclonal anti-BAP (B4-78) stained with a PE-conjugated secondary Ab. The quadrant limits were set so that the left upper quadrant that defines the specific fluorescence for the BAP+ cells contains less than 5% of the nonspecific fluorescence from the irrelevant mouse IgG1 isotype control. (d and e) The analogous single-color flow cytometry using the human Fc-FITC control and OPG-Fc-FITC probe for RANKL+ sorted cells, respectively. (f) The dual-color dot plot profile for BAP+/RANKL– sorted cells (left upper quadrant), BAP–/RANKL+ sorted cells (right lower quadrant), and for combined BAP+ and RANKL+ sorted cells (right upper quadrant). The numerical percentages represent the stained cells per quadrant expressed as a proportion of total mononuclear cells in the R1 gate.

