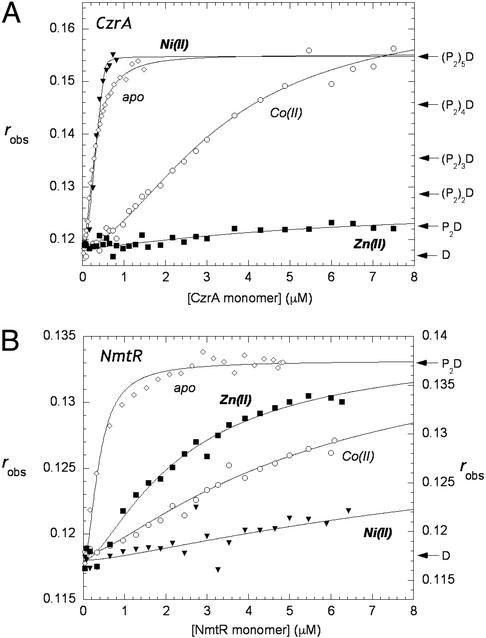
Figure 2.
(A) Fluorescence anisotropy of CzrA binding to the 57-bp fluorescein labeled oligonucleotide containing the czr O/P region in the absence (⋄) and presence of Co(II) (○), Ni(II) (▾), and Zn(II) (□). (B) Fluorescence anisotropy of NmtR binding to the 48-bp fluroescein-labeled oligonucleotide containing the nmt O/P region in the absence (⋄) and presence of Co(II) (○), Ni(II) (▾), and Zn(II) (□). (Filled symbols use left and open symbols use right axes.) All experiments were performed at 25°C in 10 mM Hepes/0.4 M NaCl/0.1 mM EDTA (EDTA is not present in the metal–protein titrations), pH 7.0. The anisotropy, robs, is plotted as a function of total protein concentration in monomer. The solid lines through the data represent nonlinear least-squares fits to the binding models described in the text for CzrA and NmtR. For Co(II)1 CzrA, K2 = 6.8 (±0.8) × 106 M−1, K3 = 3.6 (±0.6) × 106 M−1, K4 = 1.3 (±0.3) × 106 M−1, K5 = 1.1 (±0.2) × 106 M−1; all other Ki values are given in the text.

