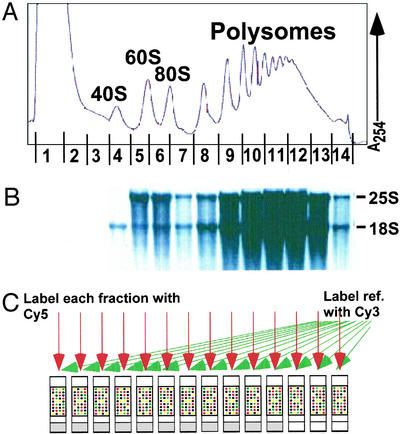
Figure 1.
Obtaining polysome profiles by microarray analysis. (A) Representative absorbance profile for RNA separated by velocity sedimentation through a 10–50% sucrose gradient (see Materials and Methods). The positions of the 40S, 60S, 80S, and polysomal peaks are indicated. The expected peaks for the tRNAs and other small RNAs in fractions 1 and 2 are obscured by the high absorbance, presumably from proteins and detergent used in the preparation. (B) RNA was extracted from each of the 14 fractions, and an aliquot from each fraction was subjected to electrophoresis through a formaldehyde gel, transferred to a nylon membrane, and stained with methylene blue. As expected, 25S and 18S ribosomal RNAs were the prominent species (markers not shown). (C) RNA aliquots from each fraction were reverse-transcribed to incorporate Cy5-dUTP, and a common reference (unfractionated RNA) was reverse-transcribed in the presence of Cy3-dUTP. The resulting labeled cDNAs from each fraction and the common reference were mixed and then hybridized to a DNA microarray containing all yeast ORFs, as predicted from the genome sequence (Saccharomyces Genome Database). Known concentrations of B. subtilis mRNAs were added to each sample immediately at collection to allow normalization of RNA levels and comparison between fractions (see Materials and Methods).

