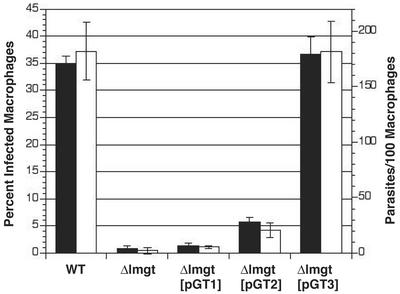
Figure 6.
Growth of WT, Δlmgt, Δlmgt[pGT1], Δlmgt[pGT2], and Δlmgt[pGT3] lines in murine peritoneal macrophages. Filled bars represent percent of infected macrophages, and open bars represent parasites per 100 macrophages for the same fields. Primary peritoneal macrophages were infected with stationary phase promastigotes, and the number of intracellular amastigotes (n = 3, average ± SD) was quantitated 6 days after infection.

