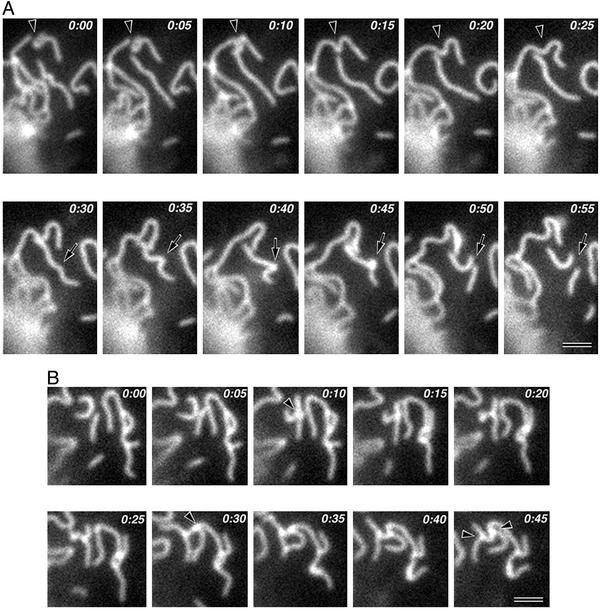
Figure 3.
Time-lapse images of the dynamic behavior of paired claudin strands. Elapsed time is indicated at the top (in min:s). (A) Breaking and annealing. Two strands were annealed to generate a single strand (arrowheads), and another single strand was broken into two shorter strands (arrows). (B) End-to-side association. Three strands formed two T-shaped junctions by end-to-side association (arrowheads) (see Movies 1–4). Bars = 1 μm.

