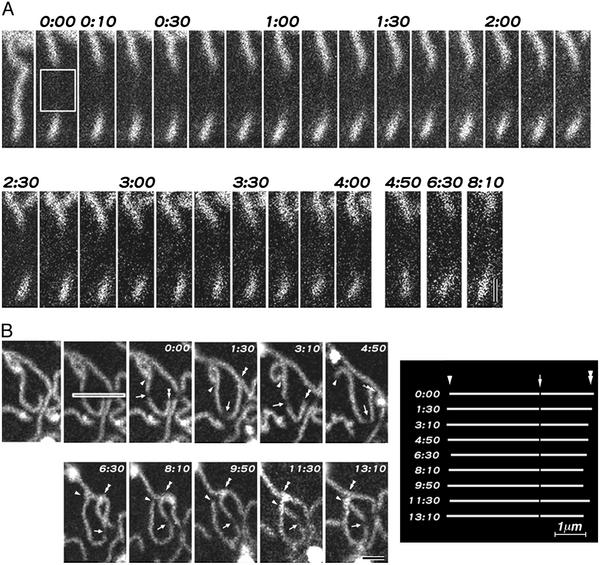
Figure 5.
Time-lapse images of fluorescence recovery after photobleaching of reconstituted strands. Elapsed time is indicated at the top (in min:s). The bleached zone is outlined by a white box. (A) A band of strand 0.9 μm in width was photobleached, and no recovery was detected. The length of the nonbleached strand segment did not appear to change. (B) A narrow (0.15-μm-wide) band of a strand was bleached. The bleached mark (arrows) remained detectable, and its relative position within the strand did not change for 13 min after photobleaching. The positions of the bleached point (arrows) relative to both ends (arrowheads and double arrowheads) were measured and summarized schematically in Right (see Movies 6 and 7). Bars = 0.5 μm (A) and 1 μm (B).

