Figure 3.
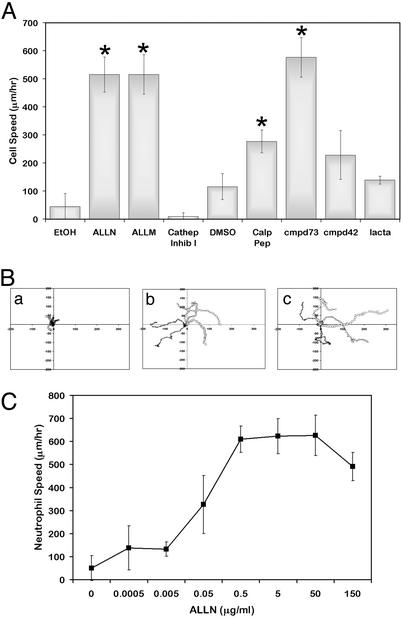
Effects of calpain inhibition on neutrophil migration. (A) Neutrophils were pretreated with EtOH, DMSO, 50 μg/ml ALLN, 50 μg/ml ALLM, 200 μM cathepsin inhibitor I, 79 μM calpastatin peptide, 75 μM cmpd73, 75 μM cmpd42, or 50 μM clasto-lactacystin β-lactone (lacta) and plated onto 2.5 μg/ml Fbg as above. Cells were imaged by time-lapse videomicroscopy, and the path of each cell was analyzed to determine cell speed as described. Data shown are the mean of three to four experiments ± SD. *, Significant differences from appropriate control (P < 0.05 by a paired, two-tailed Student's t test). See Movies 1–6 (for vehicle, IL-8, compound 73, compound 42, calpastatin peptide, and ALLN treatments), which are published as supporting information on the PNAS web site, www.pnas.org. (B) Cell paths as a function of time with each cell starting at (0,0) are shown for EtOH (Ba), ALLN (Bb), and IL-8 (Bc). (C) Neutrophils were treated with various concentrations of ALLN as above. Cell paths and resultant speeds were determined and plotted as a function of increasing ALLN concentration ± SD (n = 3).

