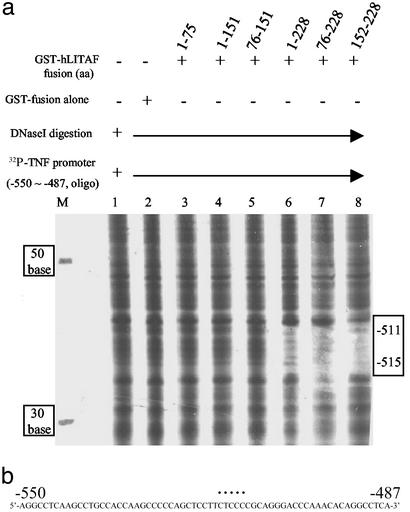
Figure 2.
Detection of hLITAF/hTNF-α DNA interaction by using footprinting. (a) [32P]ATP-labeled TNF-α promoter DNA (−550 to −487) as probe was added to each tube of reaction buffer (lanes 1–8) but mixed with GST-hLITAF fusion protein in lanes 3–8. Nonprotein (lane 1), 0.1 μg of GST-fusion protein alone (lane 2), and 0.1 μg of GST-hLITAF fusion protein amino acids 1–75 (lane 3), 1–151 (lane 4), 76–151 (lane 5), 1–228 (lane 6), 76–228 (lane 7), and 152–228 (lane 8) were mixed with probe. The mixtures were digested with DNase I (Promega) for 5 min, then that reaction was terminated by adding stop solution. Samples were then run in 6% polyacrylamide sequencing gels. [32P]ATP-labeled DNAs (30, 50, and 70 bp) were used as markers on the left side of the gel, and those marker molecular weight values were indicated as shown (lane M). The protected, undigested DNA is in the gap, indicated by a box on the right side of the gel. The DNase I-degraded DNA was measured base by base in comparison with markers. (b) The sequence of TNF-α promoter DNA from −550 to −487 is shown. The specific site identified in response to hLITAF binding is indicated by a dotted line on the sequences.

