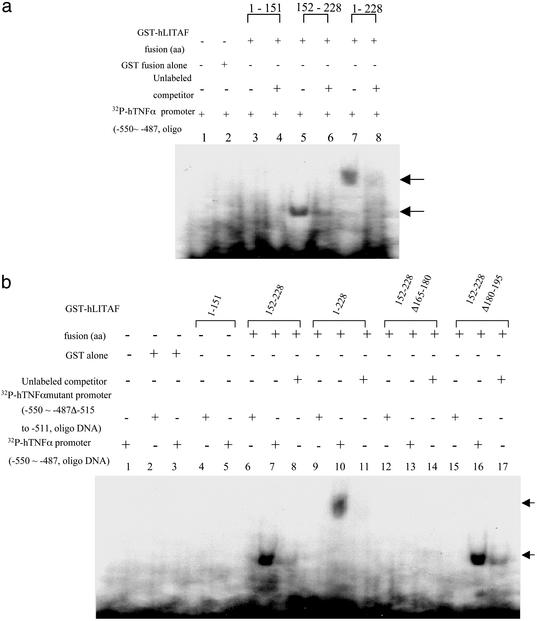
Figure 3.
EMSA of the protein–DNA interaction. (a) A probe consisting of [32P]ATP-labeled hTNF-α promoter DNA from −550 to −487 was added to each tube of reaction buffer. Probe alone (lane 1) and mixed with a 50-fold excess of unlabeled competitor (lanes 4, 6, and 8), 0.1 μg of GST-fusion protein alone (lane 2), and 0.1 μg of GST-hLITAF amino acids 1–151 (lanes 3 and 4), 152–228 (lanes 5 and 6), and 1–228 (lanes 7 and 8) are shown. The only shifted DNA band is indicated by an arrow. (b) [32P]ATP-labeled TNF-α promoter DNA from −550 to −487 (lanes 1, 3, 5, 7, 10, 13, and 16) or mutant DNA from −550 to −487 Δ−515 to −511 as probe was added to each tube of reaction buffer (lanes 2, 4, 6, 9, 12, and 15). The probed DNAs were mixed with a 50-fold excess of unlabeled competitor (lanes 8, 11, 14, and 17). The probe was also individually mixed with 0.1 μg of GST-fusion protein alone (lanes 2 and 3), 0.1 μg of GST-hLITAF fusion protein amino acids 1–151 (lanes 4 and 5), 152–228 (lanes 6–8), 1–228 (lanes 9–11), 152–228 Δ165–180 (lanes 12–14), and 152–228 Δ180–195 (lanes 15–17) and then incubated on ice for 30 min before electrophoresis on nondenaturing 6% polyacrylamide gel. The only shifted DNA band is indicated by an arrow.

