Figure 1.
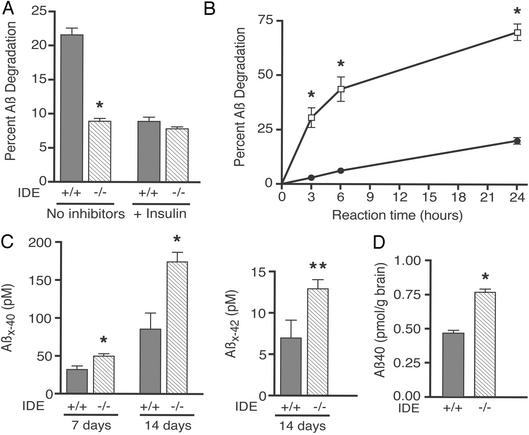
Aβ degradation and accumulation in IDE gene-disrupted mice. (A) Aβ degradation in brain membrane fractions. 125I-Aβ1-40 proteolysis in Na2CO3-washed brain membranes from two IDE −/− and two WT (+/+) mice was measured by TCA precipitation assay in the presence or absence of unlabeled insulin (3-h time point shown). Bars represent means ± SEM of 4–10 determinations from two to three independent assays (*, P < 0.00001 by Student's t test for IDE −/− compared with the IDE +/+ without inhibitors). (B) Aβ degradation in primary neurons. Age-matched cortical neurons (7–22 days in vitro) from two IDE −/− (filled circles) and two +/+ (open squares) embryonic day 17 litters were incubated with 40 pM 125I-Aβ1-40, and TCA precipitation assays were performed at the indicated time points. Graph points represent the mean ± SEM of 9–11 determinations from five to six independent assays (*, P < 0.00001). Some error bars are obscured by the symbols for data points. (C) Endogenous Aβ levels in IDE −/− neuronal conditioned media. Cortical neurons from two IDE −/− and two +/+ embryonic day 17 litters were allowed to condition media for 7 (4–11 days in vitro) or 14 days (4–18 days in vitro) before being analyzed by Aβ X-40 and Aβ X-42 ELISA. X-40 and X-42 bars represent mean Aβ concentrations ± SEM of six to eight and four to six determinations, respectively, and each determination is a mean of duplicate ELISA values (*, P < 0.005; **, P = 0.01). (D) Endogenous Aβ levels in IDE −/− brains. Represented are the mean pmol of Aβ per g of brain ± SEM of six WT and seven −/− brains from 12-week-old animals determined by Aβ X-40 ELISA (*, P < 0.00001).

