Figure 3.
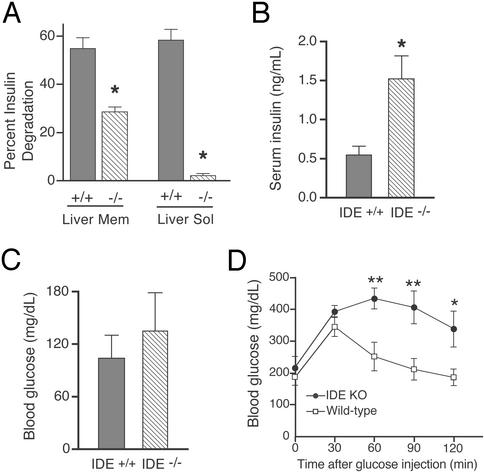
Insulin degradation, hyperinsulinemia, and glucose intolerance in IDE-deficient mice. (A) Insulin degradation in liver fractions. TCA degradation assays were performed on liver Na2CO3-washed membranes (3 h shown) and soluble fractions (30 min shown) from three IDE −/− and three WT mice. Bars represent means ± SEM of 8–12 determinations from two independent assays (*, P < 0.00001). Serum insulin (B) and blood glucose (C) levels after an overnight fast. Bars represent the means ± SEM of measurements from eight 17- to 20-week-old mice of each genotype (*, P < 0.05). (D) Glucose tolerance test. Graph points represent the mean blood glucose ± SEM of six IDE −/− (filled circles) and four WT (open squares) 28- to 30-week-old male mice after i.p. injection of d-glucose at time 0 (*, P < 0.05; **, P < 0.01).

