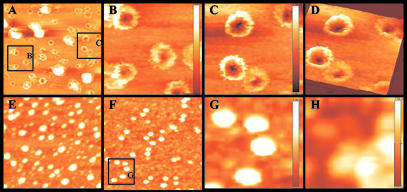
Figure 5.
Ring-like pore SecA structures observed by AFM. AFM images of SecA in various conditions. (A) Ring-like pore structure of SecA in E. coli lipid bilayers. (B and C) Zoom-in images of A. (D) Three-dimensional image of C. (E) SecA in lipids plus 2% octyl glucoside. (F) SecA in buffer without lipids. (G) Zoom-in images of F. (H) SecA in phosphatidylcholine. (Bars show the depth of the images: 9.02 nm for B, 8.36 nm for C, 6.38 nm for G, and 7.94 nm for H.)

