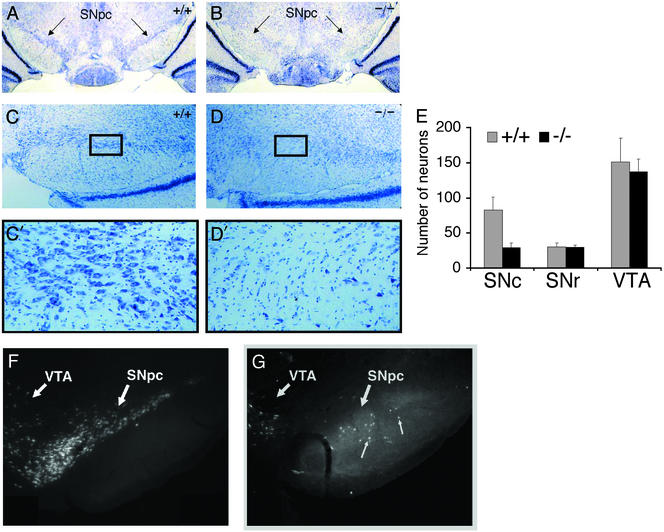
Figure 4.
Nissl staining of wt (+/+) (A and C) and ak/ak (−/−) (B and D) adult ventral midbrain. Representative coronal sections are presented to document the decreased cell density in mutant SNpc. Photographs at lower (A and B, ×25; C and D ×100) and higher (C′ and D′, boxed fields, ×400) magnification are provided. (E) Neurons in SNc, SNr, and VTA of wt and mutant Nissl-stained sections were counted. Neurons were distinguished from glial cells based on differences in cell size. Cell counts from four fields (×400 magnification) were averaged and graphed. (F and G) Retrograde labeling of ventral midbrain neurons in wt (F) and ak/ak (G) mice with Fluoro-Gold. Note the absence of cell labeling in mutant SN and aberrant labeling of cells in mutant SNr (small arrows). The neuronal population in the VTA of wt and mutant mice was similar with respect to cell density and location.

