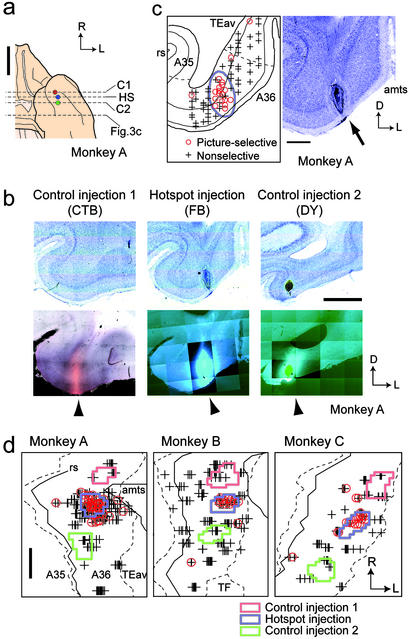
Figure 2.
Single-unit recording and tracer injection in A36. (a) Ventral view of a brain with an illustration of injection sites in A36. Circles show the locations of injection sites. Dotted lines denote the position of coronal sections containing injection sites displayed in b (HS, hotspot injection; C1 and C2, control injections) and the position of a section displayed in Fig. 3c. Data are for monkey A. (b) Bright-field (Upper) and dark-field (Lower) micrographs of coronal sections containing injection sites in A36. Arrowhead, injection site. The mosaic images were constructed by using a computerized microscope system. (c) A coronal section displaying the location of recorded neurons in A36 (Left) and the corresponding Nissl section (Right). Red circle, picture-selective neuron; gray cross, nonselective neuron; blue line, extent of the injection site; gray dotted line, border between A36 and TEav and border between A36 and A35; rs, rhinal sulcus; amts, anterior middle temporal sulcus; arrow, injection site. (d) Extent of injection to the hotspot (blue) and control injections sites (red and green). Symbols are the same as in c. Gray dotted line, border between A36 and adjacent areas; gray line, the lateral lip of the rs and the medial lip of the amts; TF, area TF; R, rostral; L, lateral; D, dorsal. [Scale bars: 10 mm (a), 2 mm (b and d), and 1 mm (c).]

