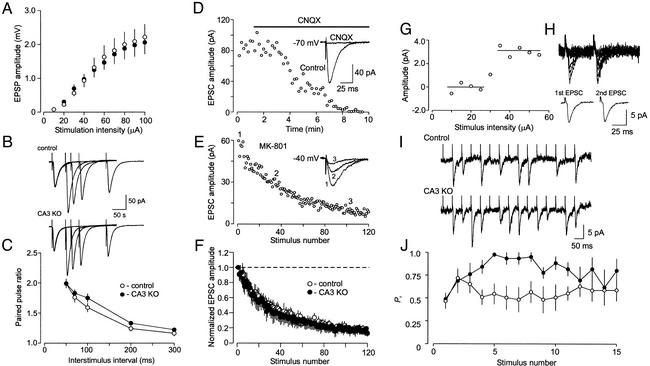
Figure 4.
Synaptic release probability at hippocampal CA3-CA1 synapses in control and CA3 α-CaMKII KO mice. (A) Comparison of synaptic efficacy using synaptic input–output curves. The extracellular field potential amplitude is plotted as a function of stimulation intensity. (B) Examples (average of 10 EPSCs) of PPF in control (Upper) and mutant (Lower) synapses. (C) PPF is plotted as a function of the interstimulus interval. Pairs of EPSCs were elicited 10–15 times for each interval tested. The values of PPF were calculated and averaged for each interstimulus interval. To calculate PPF, the EPSC for the second pulse was normalized to the EPSC induced by the first pulse. (D–F) Rate of MK-801 blockade is not altered in KO mice. (D) Synaptic responses were blocked by bath application of 20 μM 6-cyano-7-nitroquinoxaline-2,3-dione at a holding potential of −70 mV. (E) The progressive block by MK-801 (40 μM) of the NMDA receptor EPSC recorded from the same cell as in D at a holding potential of −40 mV. MK-801 was applied to the slice in the absence of presynaptic stimulation for 10 min. To measure rate of MK-801 block, the Schaffer collateral input was stimulated at 0.1 Hz frequency. EPSC amplitudes were normalized by the first EPSC. (F) Averaged data from control (open circles) and KO (filled circles) mice. Error bars show SEM. (G) An example of the intensity threshold test in a slice from control mouse. Mean EPSCs are shown as a function of stimulation current intensity (20 individual responses were averaged to obtain each point). Note the sharp threshold for the appearance of the EPSC, which indicates stimulation of a single presynaptic input. (H) Superimposed successive CA1 EPSCs recorded in response to minimal paired stimulation (50-ms interval, Upper) of a single CA3 neuron. (Lower) Traces represent average of successes only (potency) for first (Left) and second (Right) EPSCs. Potency value for first EPSC = 6.3 pA; for second EPSC, =6.2 pA. (I) Representative traces of unitary EPSCs recorded in response to short trains (15 stimuli, 50-ms interpulse interval) of presynaptic stimulation in slices from control (Upper) and CA3 α-CaMKII KO (Lower) mice. (J) Estimates of release probability at unitary synapses during repetitive stimulation in slices from control (open circles) and KO (filled circles) mice. Trains of unitary EPSCs were elicited 8–12 times for each cell tested. All unitary responses were classified as 1 (successes) or 0 (failures of synaptic transmission). The obtained parameters were then averaged for each individual experiment to provide an estimate of probability of success (the situation when release occurred).

