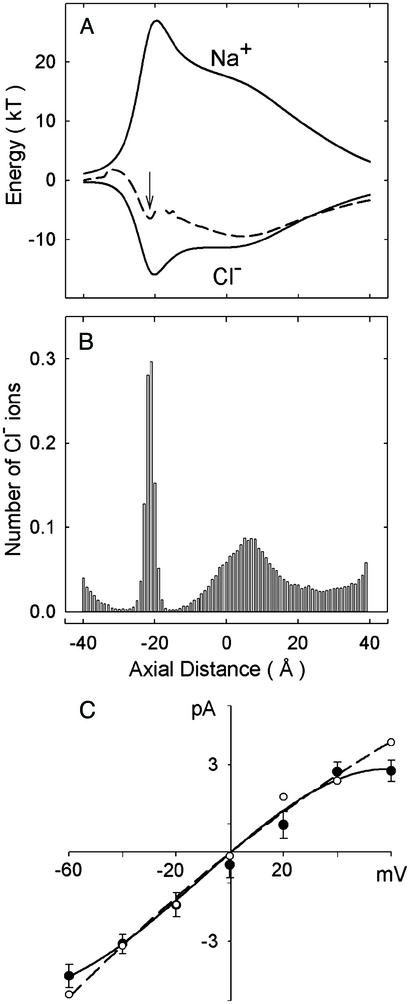
Figure 2.
Properties of the model GlyR deduced from electrostatic calculations and Brownian dynamics simulations. (A) The energy profiles encountered by a Na+ ion (upper solid line) and a Cl− ion (lower solid line) are illustrated. The profile encountered by a second Cl− ion entering the channel from the extracellular space, with one Cl− ion resident in the selectivity filter (at the axial position z = −20 Å, indicated by the arrow) is shown in the middle (broken line). (B) A dwell histogram indicates the region of the channel where Cl− ions preferentially reside. The channel is divided into 80 sections, and the average number of ions in each slice is counted during a simulation period of 1 μs. (C) The simulated current–voltage relationship obtained from the model GlyR (filled circles) is compared with that obtained experimentally. Simulated error bars have a length of one standard error of the mean in this and subsequent figures and are not shown when they are smaller than the data points.

