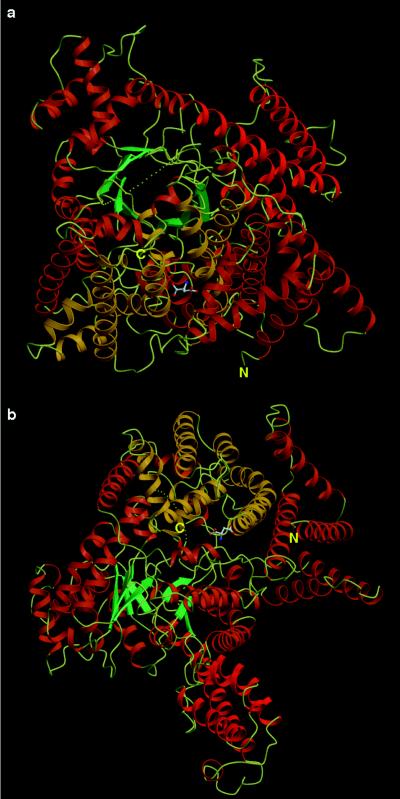
Figure 3.
(a) Ribbon drawings of a PEPC monomer projected in the same direction as the orange subunit shown in Fig. 1a. (b) Ribbon diagram of a PEPC monomer as in a but rotated 90° around a horizontal axis. The α helices (α1–α32) and (α33–α40) are shown in orange and yellow, respectively. The four-helix bundle (α11, α13, α14, and α15 + α16) is shown in red. The eight β-strands are in blue green, and the connecting loops are in pale yellow. The pale yellow dotted line corresponds to the loop that could not be defined in the electron-density map. The negative allosteric effector, l-aspartate, is shown in a ball-and-stick model.

