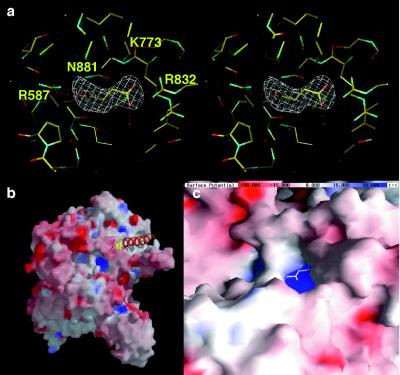
Figure 5.
Aspartate binding site in E. coli PEPC. (a) Stereoview of the aspartate binding site. The map was calculated with (Fo − Fc, αcalc) in the resolution range of 10–2.8 Å, omitting aspartate coordinates, and contoured at the 4σ level. (b) View of electrostatic surface potential of PEPC calculated by grasp (25), omitting the aspartate and N-terminal helix (α1) coordinates. The N-terminal helix near the aspartate binding pocket is shown in orange. (c) Close-up view of the aspartate binding pocket. The effector l-aspartate binds in the inner part of the pocket.

