Figure 6.
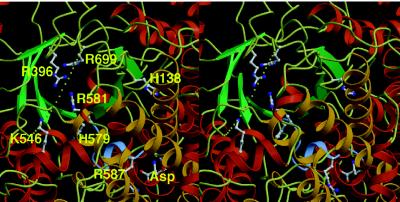
Stereoview of the probable active site of PEPC. H138, R396, K546, H579, R581, R587, R699, and aspartate are shown in ball-and-stick representation. The figure is drawn in the same orientation as Fig. 3a. The loop region of GRGGSIGRGG is shown in blue. The missing loop from Lys-702 to Gly-708 is shown as dots.

