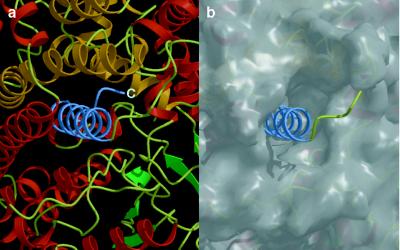
Figure 7.
(a) The C-terminal helix (α40), shown in blue, is embedded in the PEPC monomer. The figure was produced with molscript (37) and raster3d (38). (b) The molecular surface, omitting the C-terminal helix coordinates, was calculated with grasp (25). The figure is shown in the same orientation as a.

