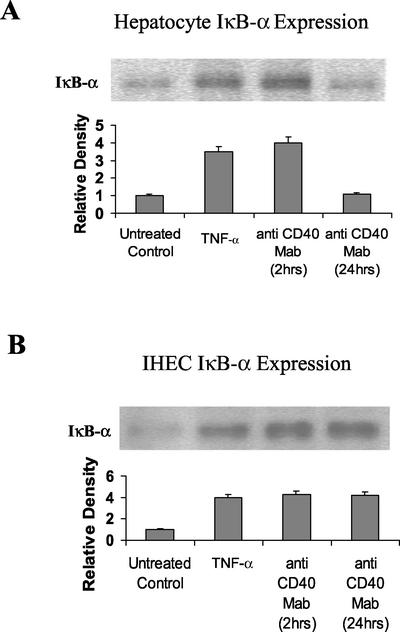
Figure 3.
Western Immunoblots showing changes in levels of cytoplasmic IκBα in CD40-stimulated or 2-h TNF-α (positive control)–stimulated hepatocytes (A) and IHECs (B). Aliquots of cytoplasmic extracts (40 μg of protein) from cultured and stimulated primary human hepatocytes and IHECs were subjected to Western blot analysis. Relative changes in IκBα levels among the two cell types, as determined by densitometric analysis, and various experimental conditions are shown in the histograms (n = 3). Consistent with the EMSA data in Figure 1 and the Western blot data in Figure 2, increased levels of hepatocyte IκBα detected after 2 h of CD40 stimulation were back to baseline at 24 h (A), whereas increased levels of IκBα were sustained >24 h in the IHECs (B). (A) Hepatocyte IκBα: lane 1, unstimulated control; lane 2, 2-h TNF-α stimulation; lane 3, 2-h CD40 stimulation; lane 4, 24-h CD40 stimulation. (B) IHEC IκBα: lane 1, unstimulated control; lane 2, 2-h TNF-α stimulation; lane 3, 2-h CD40 stimulation; and lane 4, 24-h CD40 stimulation.

