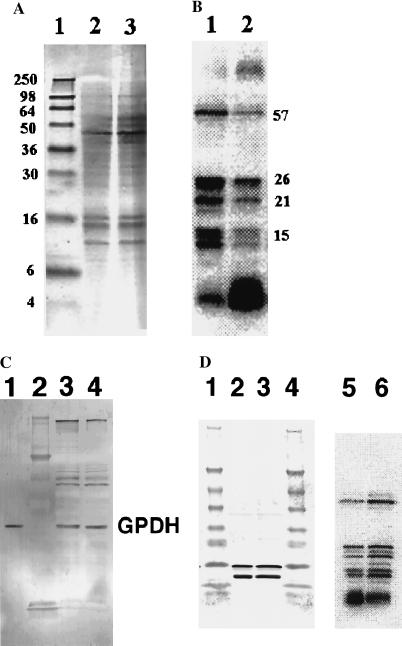
Figure 1.
Effect of HIV infection on [75Se]selenoproteins in JPX9 T cells. HIV-1-infected JPX9 T cells were cultured in parallel with control uninfected cells, labeled with 75Se, and prepared for SDS/PAGE analysis as described in Materials and Methods. (A) Coomassie blue-stained 16% polyacrylamide gel. Lane 1, molecular mass standards (sizes in kDa on left); lane 2, uninfected cell proteins, and lane 3, infected cell proteins. (B) PhosphorImager detection of 75Se-labeled protein bands. Lane 1, uninfected cells and lane 2, HIV-infected cells. Molecular masses of selenoproteins (in kDa) are shown. (C) Immunoblot detection of GPDH after 12% SDS/PAGE. Lane 1, human GPDH standard; lane 2, protein standards; lane 3, infected cell sample; lane 4, uninfected cell sample. (D) Immunoblot detection of thioredoxin after 4–20% gradient gel SDS/PAGE. Lanes 1 and 4, molecular size standards; lanes 2 and 5, infected cell sample; lanes 3 and 6, uninfected cell sample. Lanes 5 and 6, 75Se-labeled proteins in lanes 2 and 3, respectively, detected by PhosphorImager analysis. Two immunoreactive bands detected with the antibodies in lanes 2 and 3 indicate the presence of native and truncated species.

