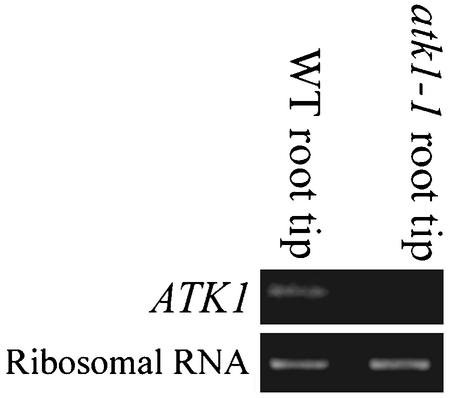
Figure 1.
ATK1 expression. Using RT-PCR with primers specific to ATK1, a 0.5-kb band was amplified in wild-type (WT) root tips, but not in homozygous atk1-1 roots (top lanes). As a control for RNA loading, RT-PCR amplification of rRNA in the two samples was adjusted to give equal intensity of a 0.4-kb band, when run on a 1% agarose gel (bottom lanes).

