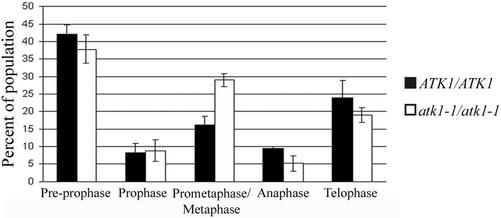
Figure 3.
Mitotic indices of wild-type and mutant cells. The percentage of cells in preprophase, prophase, anaphase, and telophase in wild-type and mutant cells are not statistically different (p > 0.05 for all). However, mutant cells have significantly more cells in prometaphase/metaphase as compared with wild-type cells (p < 0.05). Error bars represent SE. The Student's t test was used to calculate p values.

