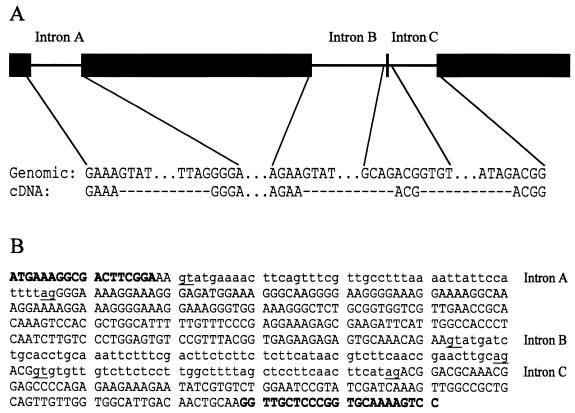
Figure 4.
(A) Schematic representation of a genomic PCR product corresponding to a segment of the E. gracilis fibrillarin gene and comparison with the cDNA sequence. (B) Primary sequence of the PCR product. Positions of the three introns (lower case) are indicated with the conserved GT and AG motifs at the 5′- and 3′-splice junctions underlined. Positions corresponding to the PCR primer binding sites are presented in bold.

