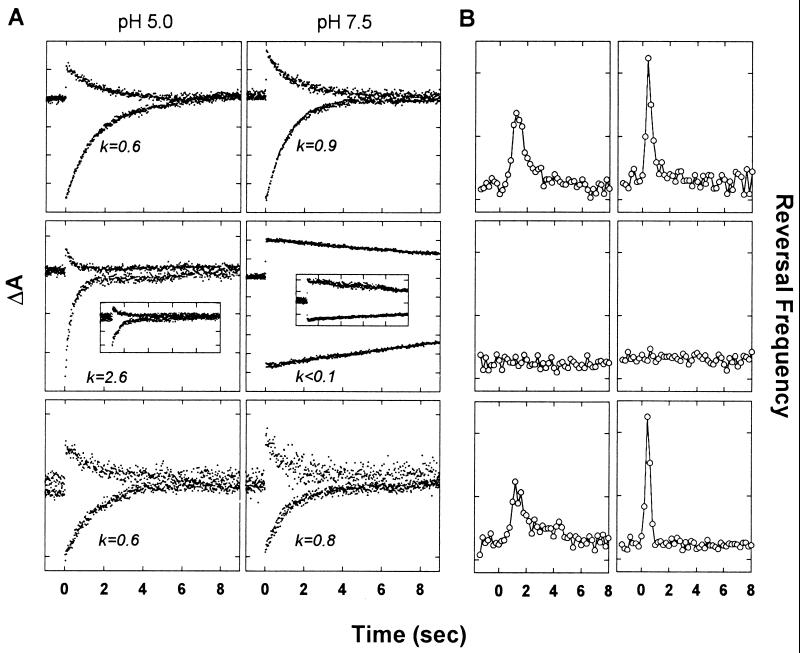
Figure 3.
(A) Transient absorption changes at 370 nm (top trace) and 590 nm (bottom trace) of Pho81Wr− membranes after a laser flash at time = 0. Each tick on the ordinate corresponds to 5 × 10⁻⁴ absorbance units. Rate constants in sec−1 of the 590-nm trace from single exponential fits are shown. Top, SRI and HtrI; Middle, transducer-free enSRI (24). The insets in the middle row show the flash photolysis data for the SRI–HtrII pair (see text); Bottom, SRI and the Htr chimera of construct d (Fig. 1). Leftmost column, pH 5.0; rightmost column, pH 7.5. (B) Motion analysis of Pho81Wr− transformants expressing various Htr–SRI pairs. Responses to each of two saturating stimuli (initiated at 0 sec) were recorded: Left, stepdown of 600 nm light for 4 sec; Right, stepup of 400 nm light for 100 msec in a constant 600-nm background. Each tick on the ordinate corresponds to 0.1 sec−1. Top, SRI and HtrI; Middle, SRI and HtrII [same cells as used for the flash photolysis data in the inset in Fig. 3A); note that the C-terminal 15 residues of SRI were removed to increase the SRI content since construct a (Fig. 1) did not produce detectable pigment]; Bottom, SRI and the Htr chimera of construct d (Fig. 1).

