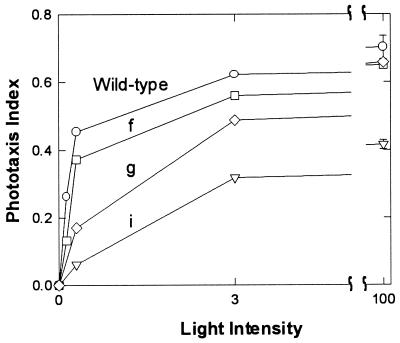
Figure 5.
Fluence/response curves of H. salinarum strain Pho81Wr− expressing various constructs listed in Fig. 1. A 1-sec pulse of 500 nm light was used for stimulation of the cells. 100% intensity was 6 × 10⁴ ergs⋅cm−2⋅sec−1 and light intensity was attenuated with neutral density filters. The phototaxis index is calculated in sec−1 as the integral of the swimming reversal frequency measured by motion analysis over the first 1 sec after the stimulus minus the integral over 1 sec starting from 6 sec after the stimulus was initiated.

