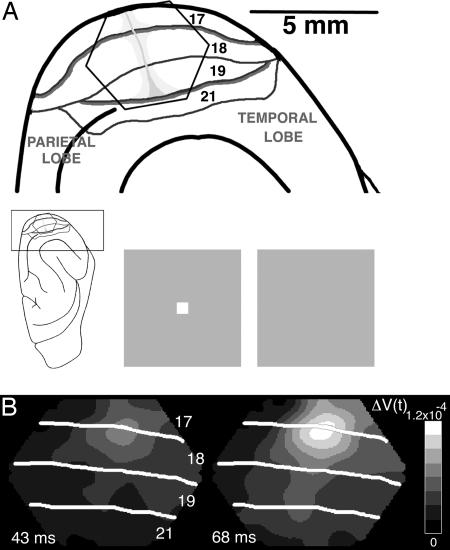
Fig. 1.
Experimental setup and visualization of FF and LSD. (A) Experimental setup. (Inset) The ferret brain with the visual cortex enlarged at the top with the cytoarchitectural areas marked. (Upper) The hexagonal photodiode array is shown overlaying visual areas 17, 18, 19, and 21. Each channel of the photodiode array sampled from a cortical area of 150 μm in diameter. The vertical meridians of the field of view are the heavy borders of areas 17/18 and 19/21. The horizontal meridian is light gray and runs orthogonally to the vertical (12). (Lower) The stimulus, a 2° × 2° white square or dark gray square (not shown), was presented for 83 ms. The control was a homogenous gray background of the same average luminance. (B) FF and LSD. Two frames of the absolute signal ΔV(t) at the times indicated in milliseconds after the start of the square stimulus. The FF is seen only indirectly in the ΔV(t), after the depolarizations spread to supragranular layers of cortex.

