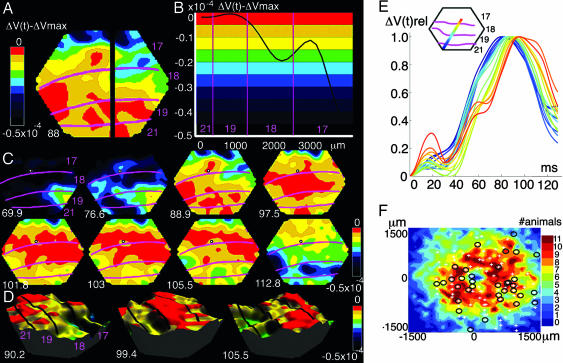
Fig. 3.
Spatial characteristics of the FBW. The color coding is identical in A–D, as shown by the scales. (A) The spatial distribution of the ΔV(t)xy − ΔVxy,max at time 88 ms after the start of the stimulus. Note the FBW reaching first the square representation at the cytoarchitectural border between areas 17 and 18. (B) Snapshot of the FBW shape at 88 ms along the black section in A. The wavelength is larger than the span of the four visual areas. (C) Eight snapshots of the FBW at the poststimulus times indicated in milliseconds. The center of gravity of the square representation is shown with a small circle at the area 17/18 border. The FBW starts at a corner of the temporal lobe (69.9 ms); it runs first to the 19/21 representation and then fast to the 17/18 square representation (76.6 ms), where it maximally depolarizes the square representation (88.9 ms). The ΔV(t)xy then decreases at square representation (97.5 ms and following frames); later, maximal depolarization of the figure background (101.8–105.5 ms) occurs. FBW maxima surround the 17/18 square representation (103 ms). (D) Three snapshots of the FBW passage in 3D for animal 1. (E) FBW depicted as a traveling wave propagating in animal 2 along the cortical path (Inset). The change in depolarization of each channel is color-coded according to the detector’s position in the path (Inset). Ordinate: ΔV(t)rel; abscissa, time after start of stimulus. (F) The electrode penetration sites in the cortex in relation to the average representation of the square at the area 17/18 border. Axes show the distance from the center of representation. + denotes that no statistically significant spike trains were found; circles denote statistically significant spike trains (P < 0.001). Some penetrations had both (circle and +). The square representation was reconstructed from individual animals (for details, see Note 6). Color coding shows the number of animals having the FBW at that cortical point. Shown are 97 penetrations in the cortex representing the background. Of these 97, 30 penetrations show 64 statistically significant multiunits (P < 0.001).

