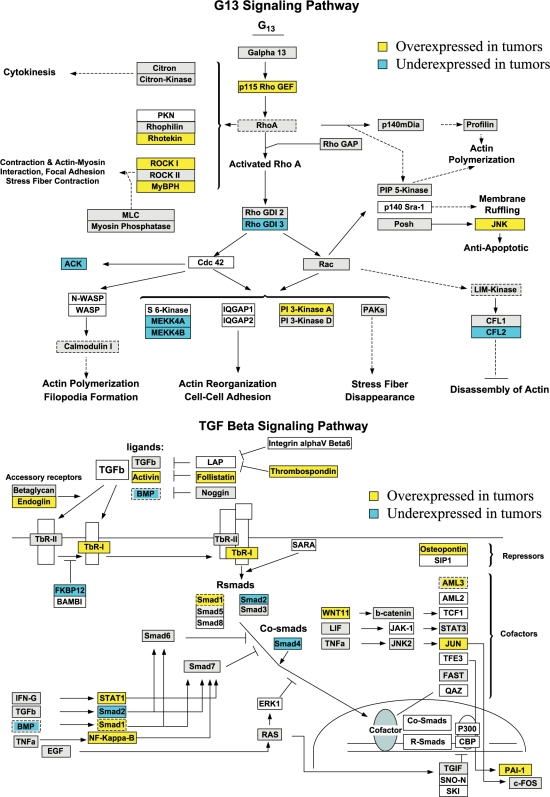
Figure 3.
GenMAPP G13 and TGF-β signaling pathways integrated in the mouse bladder tumorigenesis with cutoff fold change ≥1.5 and P < .05. Yellow and blue indicate overexpressed and underexpressed genes in the tumor samples, respectively. Grey indicates that the selection criteria were not met but the gene is represented on the array. White boxes indicate that the gene was not present on the chip.

