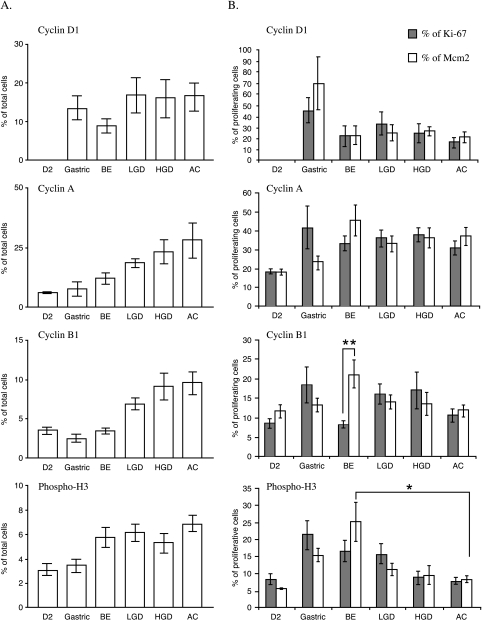
Figure 5.
Expression of the cell cycle markers (cyclins D1, A, and cyclin B1, and pH3) in the gastric antrum (gastric), second part of the duodenum (D2), BE, LGD, HGD, and AC. Panel A shows data as a percentage of total cells. Panel B shows data as a percentage of the proliferative fraction. The percentage of the proliferative fraction was calculated by dividing the percentage of expression of each marker in a given sample by the percentage of proliferating cells (either Mcm2 or Ki-67) in the same slide. *P < .03; **P < .005.

