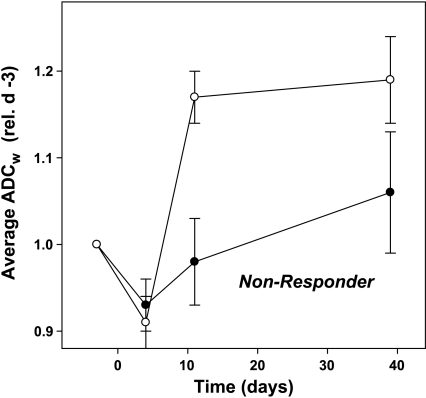
Figure 5.
Distribution of ADCw values for nonresponders and responders and volumes. Patients with positive responses or stable disease (classes 3–5) were grouped as responders (○), and those in classes 1 and 2 were grouped as nonresponders (●). Data show ADCw values (± SD) normalized to the individual pretherapy baseline ADCw for each patient. Data points are shown for baseline, day 4 (P = .312), day 11 (P = .066), and day 39 (P = .074).

