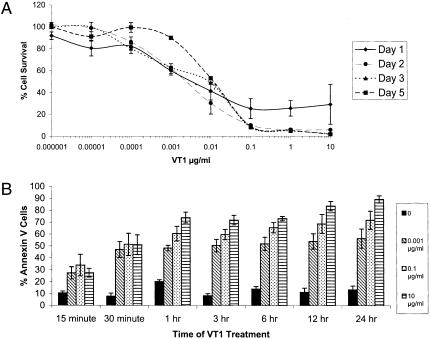
Figure 3.
VT1 sensitivity of IOMM-Lee cells. (A) Increasing concentration of toxin by 10-fold dilutions leads to a decrease in the number of viable cells (CD50 of 0.01 µg/ml) and this dose response is sustained over the course of 1, 2, 3, and 5 days after initial treatment with VT1 (n=3 for each point on the graph). (B) The percentage of annexin V-positive cells, an indicator of cell death, increases with higher concentrations of VT1 (0.001, 0.1, and 10 µg/ml). Each bar graph represents average percentages of five HPFs taken from two samples.

