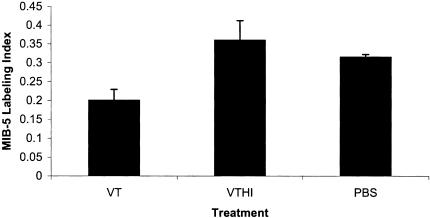
Figure 6.
Anti-proliferative effects of VT1 on IOMM-Lee-derived tumours. Graph illustrates a reduction in the percentage of cells stained with the proliferation marker, MIB-5, in VT1-treated animals (20±0.029%). Compared to HI-VT (36±0.05%, P<.0043) and PBS (31±0.007%, P<.0248), no significant different was found between HI-VT and PBS (P<.6543).

