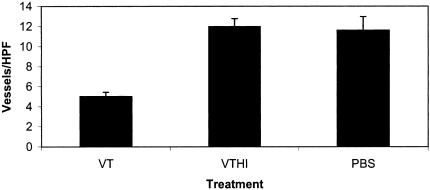
Figure 7.
Angiogenesis in IOMM-Lee tumours of treated animals. The graph depicts a decrease in the MVD of animals treated with VT1 (5±0.42). This is compared to HI-VT-treated (11.9±0.79, P<.0001) and PBS-treated (11.6±1.35, P<.0001) animals. These values were obtained by averaging the number of Factor VIII-stained vessels in five HPFs. There was no significant difference between the PBS- and HI-VT-treated groups (P<.693).

