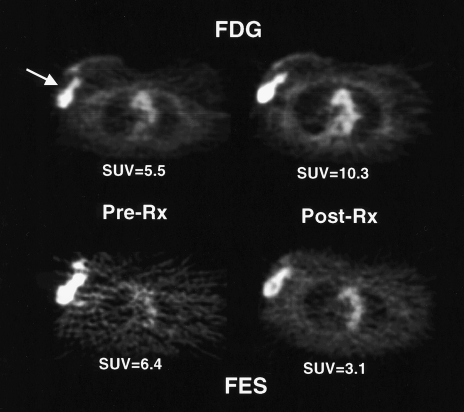
Figure 9.
“Metabolic flare” after the initiation of tamoxifen therapy. Transaxial images of a patient with a right locally advanced breast cancer taken before and one week after tamoxifen treatment. Images show an increase in FDG uptake as a manifestation of increased energy metabolism after the start of treatment. In addition, the high level of FES uptake pre-therapy and a decline after the start of therapy suggests an appropriate biologic basis for anti-estrogen therapy. The patient went on to have a response to tamoxifen. SUV refers to standardized uptake value (see text for details).

