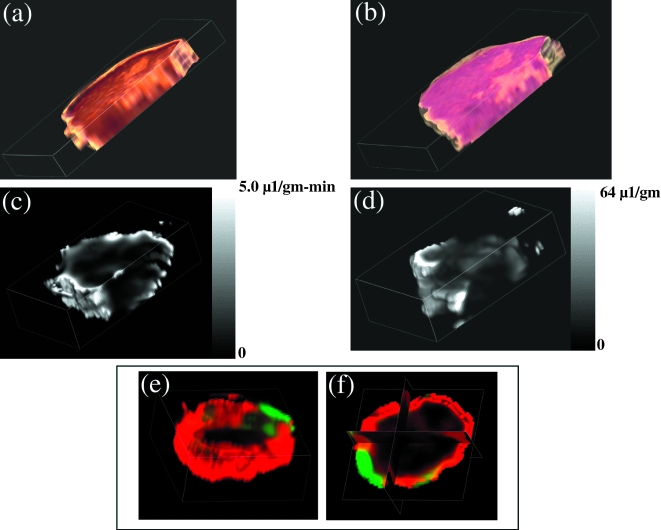
Figure 2.
Three-dimensional reconstructed maps obtained from a single MDA-MB-435-1β tumor. (a) Sections stained for VEGF expression using a rabbit polyclonal anti-VEGF antibody (Santa Cruz Biotechnology Santa Cruz, CA). (b) Hematoxylin/eosin-stained histologic sections. (c) MRI map of vascular permeability. (d) MRI map of vascular volume. (e,f) Three-dimensional and triplanar views of a fused vascular image obtained by displaying vascular volume through a green channel and vascular permeability through a red channel. Multi-slice maps of relaxation rates (T1-1) were obtained by a saturation recovery method combined with fast T1 SNAPSHOT-FLASH imaging (flip angle of 5° echo time of 2 msec). Images of eight slices (slice thickness of 1 mm) acquired with an in-plane spatial resolution of 250 µm (64x64 matrix, 16 mm field of view, NS = 16) were obtained for three relaxation delays (100 msec, 500 msec, and 1 second) for each of the slices. Thus, 64x64x8 T1 maps were acquired within 7 minutes with an Mo map with a recovery delay of 7 seconds acquired once at the beginning of the experiment. Images were obtained before i.v. administration of 0.2 ml of 60 mg/ml albumin-GdDTPA in saline (dose of 500 mg/kg) and repeated every 8 minutes, starting 10 minutes after the injection, up to 32 minutes. Relaxation maps are reconstructed from data sets for three different relaxation times and the Mo data set on a pixel-by-pixel basis. These data are from work performed by D. Artemov, M. Solaiyappan and Z. M. Bhujwalla.

